Power requirement diagram
by Flemming Lund, DMJK (first published in Danish in "Signalposten" no. 5, 1971)
When selecting a motor for a model locomotive it may be disastrous for the motor if it is not powerful enough to bring the wheels to slip on the rails. On the other hand it is a waste of energy and often a waste of limited room to use a motor that is more powerful than is nessecary. Without studying the diagram someone may object that this is not a problem and he has managed well enough until now. Perhaps so, but it has been a great pleasure compiling the following.
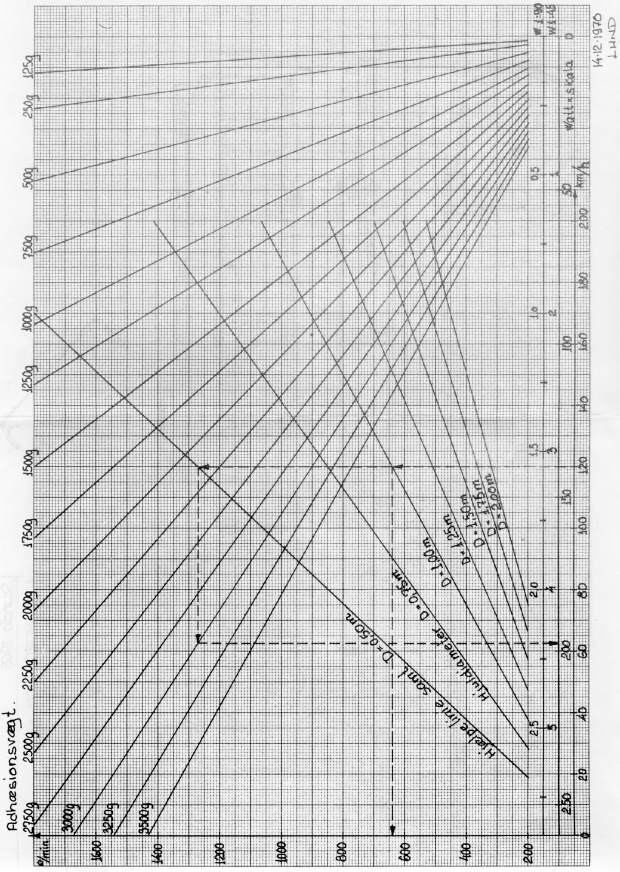
The diagram is used the following way: The prototype running speed in km/h is found at the bottom of the diagram. From the chosen speed value a vertical line is drawn to the sloping line for the prototype drive wheel diameter; from the intersection point a horizontal line is drawn to the left to find the drive wheel speed in rpm on both prototype and model. If the motor speed in rpm is known, the total gear ratio may now be calculated.
To find the power requirement in Watt the vertical line from the chosen prototype speed is extended so that the intersects the sloping construction line ("hjælpelinie"); from the intersection point a horizontal line is drawn to the sloping line for the adhesion weight in grams, i. e, the weight resting on the driven wheels of the model locomotive. From this intersection point a vertical line is drawn down to the scale Watt * scale and reads the value. By dividing this value with the model scale ratio chosen you get the theoretical power requirement at the driven wheels without taking efficiency into consideration. The two upper scales gives power requirement for 0 scale (1:45) and H0 scale (1:90). The power in Watt is the product of voltage and current: P = U * I.
In order to find the real power requirement the result must be divided by the total efficiency (the product of the single efficiencies) in motor and transmission as shown in the example below. The example is drawn into the diagram and has 4 spur gear stages and 1 helical gear stage. The power requirement in 0 scale taken from the diagram is 4.4W.
With a good motor and good bearings on the gear transmission etc. is found:

Efficiency for most electric motors is between 0.25 and 0.50, best for DC motors with permanent magnet.
Efficiency for spur gear and conical gear transmissions is between 0.90 and 0.95 per stage depending on the smoothness of the teeth surfaces and the bearings. Efficiency for helical gears and worm gear transmissions are between 0.40 and 0.70, largest if axial forces are taken by a good trust bearing like a ball bearing.

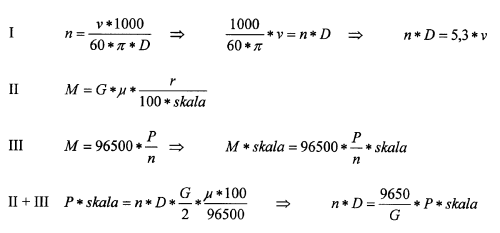
For the technically minded the basis for the diagram are the following 3 formulas and rewritings.
In the formulas are used the following symbols:
n = driving wheel speed in rpm (rotations per minute)
v = the prototype running speed in km/h
D = the prototype wheel diameter in m
M = the rotational moment in gcm
G = adhesion weight in g
µ = coefficient of friction between wheels and rails = 0.2
r = D/2 = the prototype driving wheel radius in m
P = the power in Watt

Changes:
2008-03-15: Translated from Danish.
2009-01-01: Typeface updated.